
18. Timing: Disabilities Increase Substantially after mRNA “Vaccinations”
Strong Correlations between mRNA “Vaccinations” and Disabilities Are Powerful Evidence that mRNA “Vaccinations” Caused the Disabilities
Use browser “Back” button to return to previous page.
August 23, 2023
There are very strong correlation between Disabilities and “Vaccination” in the US and UK. These very large Disability results strongly reinforce the Death timing results with completely independent data.
Very Strong Correlation between US “Vaccination” and Workforce Disabilities
This US study is powerful because of the large percentage increase in people disabled in a huge population. Its conclusions are reproduced in the UK, as shown in the next section. See US Disability Data
Huge Scale – Over 145 Million age 16-64 were employed in the US civilian workforce at the start of 2022. The U.S. Department of Labor Disability Statistics provides monthly disability data since 2008, as shown in the graph below.
Steep Increase in “Vaccination” started January 2021 with cumulative “Vaccinations” increasing throughout the year. On the graph below, cumulative “Vaccinations” are shown by the red curve starting at the beginning of 2021 (enclosed by the oval at the right). The vertical axis at the right shows cumulative “Vaccine” doses as a % of the age 19-64 population.
Enormous Amplitude – The long-term US disability baseline is about 3.3% of the workforce from 2010 to 2021. Mass mRNA “Vaccination” started in 2021 with subsequent steep increases in disabilities. Disabilities reached 4.15% by the beginning of 2022 – an unprecedented increase of 26% in a year. The jagged black line on the graph below shows the unprecedentedly steep increase in disabilities starting February 2021 when mass “Vaccination” of the workforce started. The vertical axis at the left shows the % of the labor force with a disability.
Increase In Disabilities in The Civilian Labor Force (16-64) vs Vaccine Uptake
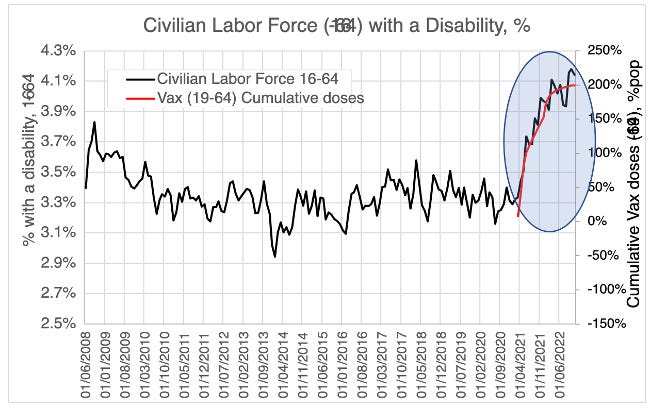
No Increase in 2020 when the worst COVID raged. Notice that the disability percentage decreased somewhat in 2020 during the worst COVID before the start of mass “Vaccinations” in 2021. This lack of increase in 2020 is strong evidence that COVID did not cause the steep increase in disabilities in 2021.
Significance – Random Chance Is Not the Explanation - On the graph above, the tight match between the steep increase in disabilities (jagged black curve) and “Vaccinations” (red curve) can’t be a coincidence. On the graph below, for each month the disability percentage is plotted against cumulative “Vaccine” doses. The upward sloping line shows the tight relationship between more “Vaccines” and more disabilities. The statistical correlation coefficient is a very high 89.5% - which is strong evidence of causation. The graph below shows orange dots for the percentage disabilities (vertical axis) vs cumulative “Vaccine” doses as a % of the population (horizontal axis).
UK Disability Data Confirms the US Increase in Disabilities after “Vaccinations”
This UK study is powerful because of the large percentage increase in people disabled in a huge population. Its conclusions reproduce the US results shown in the previous section. See UK PIP Analysis – Body Systems
Huge Scale – UK age 16-64 population is a huge 42 Million. The analysis of disabilities in the UK is based on investigation of the Personal Independence Pension (PIP) program by the Department of Work and Pensions (DWP) in the UK using monthly data.
Steep Increase in “Vaccination” – Cumulative percentage of “Vaccine” doses per person increased steeply in 2021. On the graph below, cumulative “Vaccinations” are shown by the dotted black curve starting at the beginning of 2021. The vertical axis at the right shows cumulative “Vaccine” doses as a % of the population.
Enormous Amplitude – After mass “Vaccination” started in 2021, the disability % increased by 80% from the long-term baseline of from 2016 to 2019. The light blue line on the graph below shows the unprecedentedly steep increase in disabilities starting March 2021 soon after mass “Vaccination” started. The vertical axis at the left shows Monthly Excess PIP Clearances % above trend. PIP Clearances are processed disability claims.
UK New Monthly Disability Claims Above the 2016-2019 Trend for Age 16-64
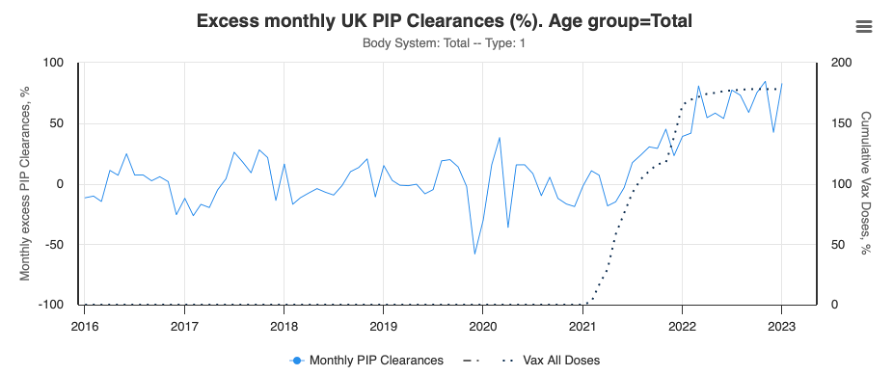
No Increase in 2020 when the worst COVID raged. Notice that the disability percentage decreased somewhat in 2020 during the worst COVID before the start of mass “Vaccinations” in 2021. This lack of increase in 2020 is strong evidence that COVID did not cause the steep increase in disabilities in 2021.
Significance – Random Chance Is Not the Explanation - This UK study is strong because of the huge 80% increase in disabilities for the enormous UK population. On the graph above, the tight match between the steep increase in disabilities (light blue curve) and “Vaccinations” (dotted black curve) can’t be a coincidence.
Powerful Combined Results: Together US and UK Results Help Prove Causation
Individually, the dramatically large 2021 increases in disabilities for very large US and UK populations provide very strong evidence that mRNA “Vaccines” were the cause. The slight decreases in 2020 prove that COVID was not the cause. The evidence is especially strong because of the very tight correlations between monthly disability levels and cumulative monthly “Vaccine” doses for both the US and UK. Those tight correlations can’t have been a random coincidence and can’t have been caused by COVID, which is the only plausible alternative cause of the increases.
In combination, the close agreement between the US and UK disability results reinforces each other and provides overwhelming evidence that mRNA “Vaccines” caused the steep increases in disabilities.
Reference
US Disability Data
Part 3 – Relationship with Vaccine Uptake
Phinance Technologies (Humanity Projects) – Edward Dowd
Update Date: November - 2022
Bureau of Labor Statistics (BLS)
Data Source (BLS): U.S. Department of Labor Disability Statistics Resources.
UK PIP Analysis – Body Systems
Phinance Technologies (Humanity Projects) – Edward Dowd
July 2023, by: Bess Dalby, Carlos Alegria
Analysis of UK New Claims for Personal Independence Payment (PIP) by Body System.
Data Sources: UK Department of Work and Pensions (DWP), Office for National Statistics (ONS), NHS vaccination statistics
Use browser “Back” button to return to previous page.